



Most salons don't have a data problem. They have a decision problem. The numbers are sitting right there in the booking system — rebook rates, no-show counts, retail attach, revenue per hour — but almost none of it turns into a clear "do this, stop that" conversation on Monday morning. Reports pile up. Nobody fully trusts them. And the big calls — hire, raise prices, cut a membership tier — still get made on gut feel and whoever talks loudest in the room.
The reason is that analytics maturity isn't one switch you flip. It's a ladder. Salons that actually get leverage from their data climbed it one rung at a time, building the right artifacts at each stage rather than jumping straight to fancy dashboards nobody can act on.
What follows is that ladder, the concrete artifacts each stage needs, and a lightweight governance pack you can adopt to make sure your experiments produce decisions instead of arguments.
Why most salons stall at "we have reports"
There's a pattern that shows up constantly. An owner buys decent software, finds the reporting tab, and starts pulling numbers. For a few weeks there's genuine excitement. Then reality sets in:
-
The numbers disagree with each other depending on how you filter them.
-
Two people look at the same chart and reach opposite conclusions.
-
A promo "worked" but nobody can actually say whether it beat doing nothing.
-
The quarterly review turns into a slideshow nobody remembers by Thursday.
What's missing isn't data. It's structure around how data becomes a decision. A salon pulling 40 reports a month but changing nothing is less mature than a salon tracking three numbers it actually acts on every week.
The maturity ladder below reframes the goal. You're not climbing toward "more analytics." You're climbing toward faster, more reliable decisions with less drama.
The five rungs
Most independent salons sit somewhere between Stage 1 and Stage 2. Multi-location groups often think they're at Stage 4 but are really at Stage 3 — they run "tests" with no stopping rule, so every test becomes a permanent argument about whether it worked. Here's how the full ladder maps out:
Stop losing appointments in the chaos.
Salnly helps you book, confirm & manage every appointment—efficiently.
- Centralized appointment management
- Client notifications
- Calendar & staff scheduling
No credit card required
| Stage | What it looks like | Core risk | Artifact that unlocks the next rung |
|---|---|---|---|
| 1. Reactive | Numbers pulled only when something goes wrong | Decisions made on anecdotes | Standard weekly dashboard |
| 2. Reporting | Regular reports exist, but no action loop | "Nice charts, no change" | Decision log tied to each metric |
| 3. Diagnostic | You can explain why a number moved | Confusing correlation with cause | Hypothesis template |
| 4. Experimental | You test changes before rolling out | Tests that never conclude | Sample-size calc + stopping rules |
| 5. Governed | Experiments run on a predictable cadence with owners | Learning gets lost between quarters | Quarterly learning log + governance pack |
Each rung has a specific artifact attached to it — and that artifact is the thing that actually moves you up. Skipping them is how salons end up with sophisticated-looking reporting and no change in how they make decisions.
Stage 1 → 2: Build one standard dashboard before anything else
The jump from reactive to reporting is less about tooling and more about agreeing on definitions. In real operations, the thing that kills early analytics is that "rebook rate" means four different things to four people. One counts rebooks made in-chair. Another counts anyone who returns within 60 days. Another excludes color clients. You can't improve a number nobody defines the same way twice.
The artifact: a standard weekly dashboard with locked definitions.
-
Revenue per booked hour (not per appointment — per hour)
-
Rebook rate, defined exactly (e.g., "% of completed appointments that leave with a future booking")
-
No-show + late-cancel rate combined
-
Retail attach rate (% of service tickets with a product)
-
New vs. returning client mix
-
Utilization (booked hours ÷ available chair hours)
Before building the dashboard, it's worth grounding your metric picks in which salon KPIs actually move profitability and the daily actions behind them — because a dashboard full of vanity metrics is worse than no dashboard. It gives you something to argue over without anything to do about it.
One rule that saves months of pain: the definition lives next to the number, permanently.
A small footnote on every dashboard — "rebook = future appointment booked before client leaves" — ends the recurring Monday fight about what the chart actually means.
Stage 2 → 3: Make every number explain itself
A reporting salon knows rebook rate dropped from 48% to 41%. A diagnostic salon knows why — and that's the real leap.
The artifact: a simple segmentation habit. Before explaining any movement, break the number by:
-
New vs. returning
-
Service category (color, cut, treatment)
-
Stylist tier (junior vs. senior)
-
Day-part (quiet midweek hours behave completely differently from weekends)
A huge amount of "mysterious" metric movement dissolves the moment you split by day-part. Your Tuesday 10am–2pm block and your Saturday block are practically two different businesses. If underperforming hours are muddying your averages, an hourly system to surface underperforming hours is the diagnostic lens that keeps you from drawing salon-wide conclusions from a problem that lives in six specific hours a week.
The insight most owners miss at this stage: a number that only exists as a salon-wide average is almost impossible to act on. You can't coach "the whole salon." You can coach juniors on color rebooks during weekday afternoons. Diagnostic maturity is really just the discipline of always asking "for whom, and when?"
Stage 3 → 4: Stop rolling things out and start testing them
This is the rung where most salons quietly give up — not because testing is hard, but because their tests never end. They try a new confirmation message, it feels better, they keep it, and three months later nobody can say if it actually did anything. That's not an experiment. That's a vibe with extra steps.
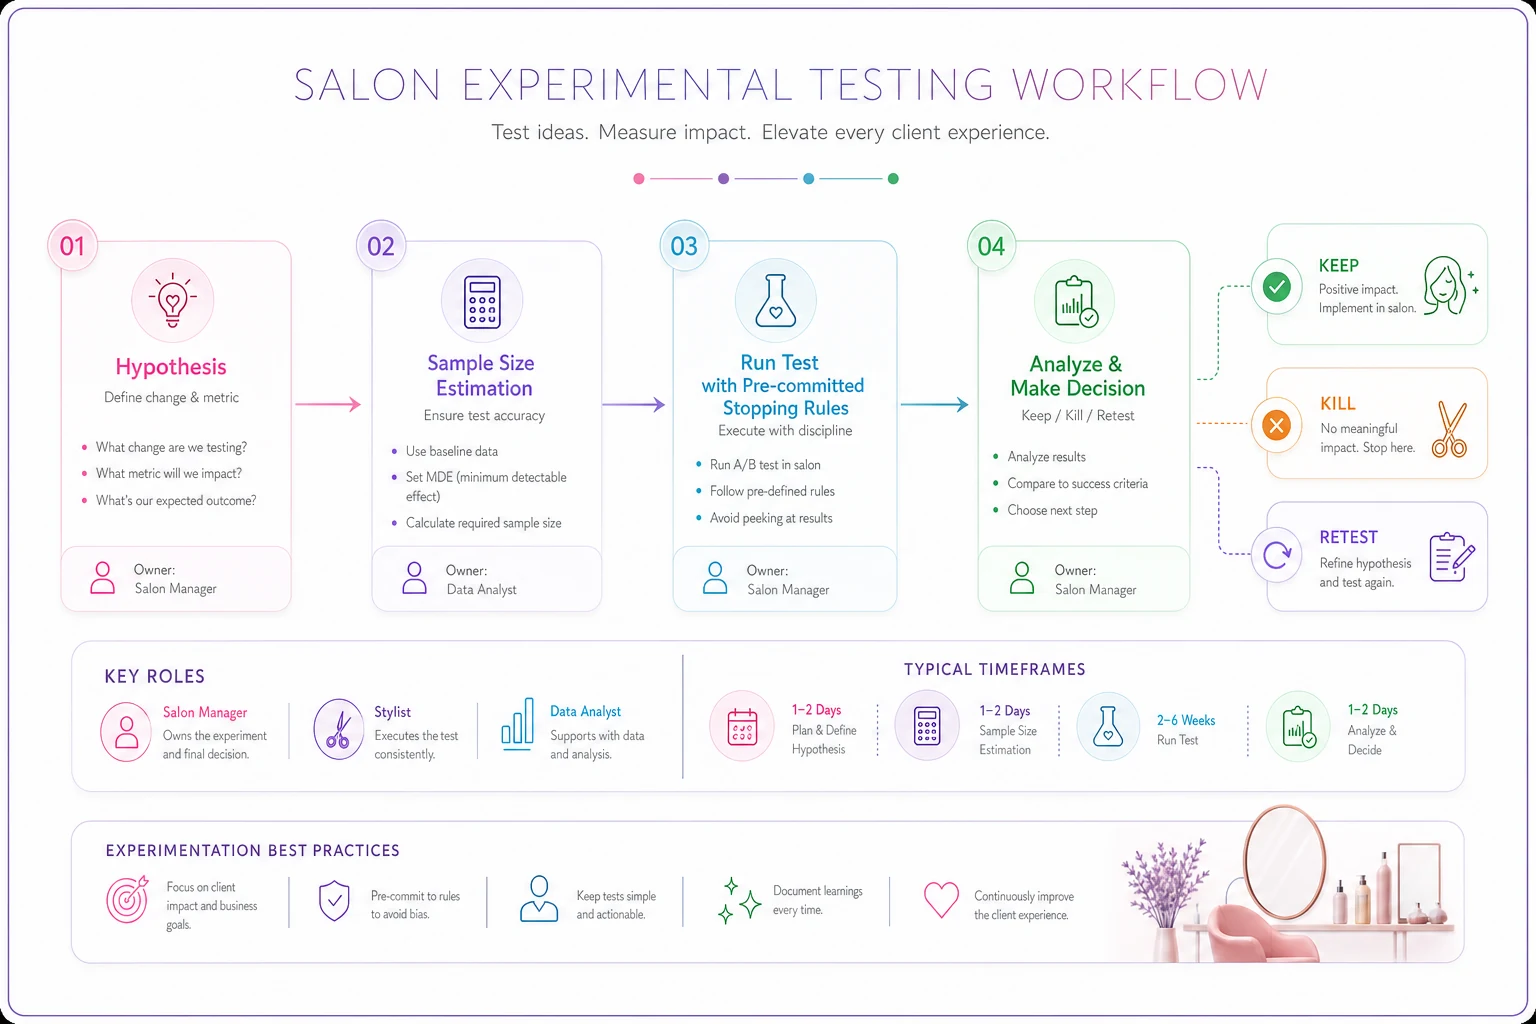
Real experimental maturity needs three artifacts working together: a hypothesis template, a sample-size estimate, and a stopping rule you commit to before you start.
The hypothesis template
Force every proposed change through one short structure. If it can't fill this out, it's not ready to test:
-
Change what exactly are we doing differently?
-
Metric the single number this should move (not three — one primary).
-
Expected direction and size "we think rebook rises from ~44% to ~50%."
-
Who/when which clients, which day-parts, which stylists.
-
Decision if it works / if it doesn't written down now, not later.
That last line is the one everyone skips, and it's the one that matters most. Deciding the consequence before you see results is what stops you from moving the goalposts when the data is disappointing.
A visual of the testing workflow helps teams stick to the plan.
Sample size, salon-sized
You don't need to be a statistician, but you need a rough sense of how many appointments it takes before a result means anything. A salon doing around 330 appointments a month can detect a big swing — say, 10+ percentage points — in a few weeks, but a small 2–3 point improvement might take a couple of months to show up reliably, if it ever clears the noise.
The practical move: for small expected effects, either run the test longer or don't bother. Chasing tiny lifts with tiny samples is how salons convince themselves random noise is a strategy.
Stopping rules
Set two numbers up front: a minimum run time (or minimum sample) and a clear "we're calling it" threshold. No peeking at day three and declaring victory. For the mechanics of minimum samples and when to cleanly close out an operational test, the walkthrough in a salon-sized A/B testing framework for operations pairs directly with this rung — it covers the exact stopping-rule logic that keeps a two-week test from turning into a six-month opinion.
Stage 4 → 5: Governance is what makes it repeatable
Plenty of salons run one good experiment, get a win, and then nothing. The knowledge lives in the owner's head. Six months later a new manager proposes the exact thing that already failed, and the whole cycle repeats. Stage 5 is about institutional memory — turning individual experiments into a system that doesn't forget.
The artifact: a quarterly learning log. One page, four columns, updated every quarter:
-
What we tested
-
What we expected
-
What actually happened
-
What we decided (keep / kill / retest)
The magic isn't the log itself — it's that it forces a clean verdict on every experiment. "Inconclusive" is an allowed answer. "We never finished it" is not. Over a year this becomes the most valuable document in the business, because it tells you what's genuinely been tried and ruled out.
A reproducible experiment governance pack
Here's the lightweight pack an owner can actually run without hiring an analyst. Five documents, and they stack:
-
The standard dashboard (Stage 1 artifact) — the shared source of truth with locked definitions.
-
The hypothesis template — every proposed change fills one out, no exceptions.
-
A sample-size / duration note — even a rough "run this for 6 weeks minimum" written at the top of each test.
-
The stopping rule — pre-committed thresholds, so results are honored, not negotiated.
-
The quarterly learning log — the memory layer.
Run these on a fixed cadence: one monthly review to check the dashboard and pick the next test, one quarterly review to update the learning log and retire old assumptions. That rhythm is the whole game. Analytics maturity isn't a software purchase — it's a meeting cadence with artifacts attached.
A real scenario: a two-location salon climbing the ladder
A two-location salon doing roughly 600 combined appointments a month was stuck at Stage 2 for over a year. They had reports — plenty of them — but every decision still came down to whichever senior stylist felt strongest that week. Memberships, pricing, promo timing: all gut.
Their first real move wasn't fancy. They cut their dashboard from around 20 metrics down to six, locked the definitions, and assigned each number an owner. Within a month the Monday review stopped being a debate about what the charts meant.
Then they ran their first honest experiment: testing whether offering a rebook incentive at the chair beat offering it at checkout. They wrote the hypothesis, set a six-week minimum, and committed to a stopping rule before starting. The result was modest but real — rebook rate moved from around 43% to the high-40s at the test location, and it held. Because they'd pre-written the decision, there was no argument about rolling it out.
The bigger shift was cultural. By the end of two quarters their learning log had about eight entries — a few wins, a couple of clear kills, two inconclusive. The inconclusive ones mattered just as much: they stopped re-litigating ideas that had already been tested. Decisions got faster and quieter. That's what maturity actually feels like day to day — not more dashboards, just less drama.
When this makes sense — and when it doesn't
When to invest in climbing the ladder:
-
You're making recurring, reversible decisions (promos, scripts, scheduling rules) where small improvements compound.
-
You have enough volume — roughly 250+ appointments a month — for tests to produce signal.
-
You have more than one person involved in decisions, so "trust me" no longer scales.
When it's a bad idea to go full Stage 4+:
-
You're a single-chair operation making a handful of big one-off calls a year. Formal experimentation is overhead you don't need — a clear dashboard is plenty.
-
You're in a cash crisis. Fix the bleeding first; experiment later.
-
Your data is still a mess. If definitions aren't locked, every experiment inherits that confusion. Stabilize Stage 1 before reaching for Stage 4.
Who should not do this yet: owners who haven't agreed on what their core metrics even mean. Building a stopping-rule framework on top of undefined numbers just produces confident wrong answers faster.
Where tooling quietly helps
None of this requires exotic software — but it does require that pulling the dashboard isn't a 40-minute manual export every Monday, because if it's painful, it won't happen. The practical value of a solid operational platform is boring and real: consistent definitions applied automatically, segments you can slice without rebuilding spreadsheets, and enough history to look back on when you update the learning log.
When data is a chore to assemble, teams default right back to gut feel. When it's a click, the cadence actually survives contact with a busy Saturday.
The point of the ladder
You don't climb this ladder to have better charts. You climb it so the question "should we do X?" gets a cleaner, faster answer every time — and so the answer sticks instead of getting re-argued next quarter. Start at the rung you're honestly on. If your definitions aren't locked, that's your work this month, not a dashboard redesign. If you're running "tests" with no stopping rule, write one before your next experiment.
Maturity here is less about sophistication and more about discipline: fewer metrics, clearer definitions, honest verdicts, and a memory that outlasts whoever happened to be in the room. Build the artifacts one rung at a time, and the reports finally start doing what they were always supposed to do — settle decisions instead of starting arguments.
Ready to simplify your salon operations?
Join 1,000+ salons using Salnly to save time, reduce scheduling chaos, and deliver better client experiences.