



Owning three or five salons doesn't make you a bigger single-salon operator. It makes you a portfolio manager who happens to know how to color hair. And the moment you cross that line, the thing that quietly kills you isn't a bad stylist or a slow month — it's that you can no longer see your money clearly enough to move it well.
Most multi-unit owners run their locations like a parent with favorite children. The flagship gets attention because it's the original. The newest store gets cash because it's struggling. The middle locations get ignored because they're "fine." Nobody's deciding anything on the numbers. They're deciding on emotion, habit, and whoever complained loudest at the last manager meeting.
Portfolio financial governance is the opposite of that. It's a set of rules — written down, applied the same way every month — that tells you where to invest, where to pull back, and where to consider closing before the decision gets made for you. This article is about building that system: normalized per-chair P&Ls, runway thresholds, capital allocation rules, and a monthly review pack that turns unit metrics into actual decisions.
Why per-chair P&Ls lie when you don't normalize them
There's a trap nearly every growing owner falls into. You pull a P&L for each location, compare the bottom lines, and feel like you're being data-driven. But a raw location P&L tells you almost nothing useful, because your locations aren't comparable. One has 6 chairs, another has 10. One pays $4,200 rent, another pays $9,800. One is three years old with a loyal book, another opened eight months ago.
Comparing those bottom lines is like comparing two stylists' total revenue without noticing one works 38 hours and the other works 22. The number is real. The comparison is garbage.
Normalization means reducing every unit to the same denominator so you're comparing apples to apples. For salons, the chair (or station) is the natural unit — it's the thing that actually produces revenue and consumes most of your fixed cost. When you normalize per chair, hidden problems jump out immediately.
A typical example looks like this. Two locations, both roughly $60k in monthly revenue, both "fine" on paper:
| Metric | Location A | Location B |
|---|---|---|
| Chairs | 6 | 10 |
| Monthly revenue | $61,000 | $59,000 |
| Revenue per chair | ~$10,170 | ~$5,900 |
| Fully-loaded cost per chair | ~$6,800 | ~$6,100 |
| Contribution per chair | ~$3,370 | ~$0 (break-even) |
On the surface these two look like twins. Normalized, Location A is a quietly excellent business and Location B is a chair-heavy operation treading water — too much capacity for the demand it generates. If you were going to give one of them $40k for a renovation, the raw P&L would make it a coin flip. The normalized view makes it obvious.
The point isn't the specific numbers. It's that the unit of comparison has to be the thing that scales, and for salons that's the chair, not the building.
What "fully-loaded per chair" actually includes
A per-chair number is only honest if the cost side is complete. The common mistake is loading only direct costs — stylist pay and product — and leaving rent, front-desk payroll, software, insurance, and management overhead at the location level. That flatters high-chair-count stores and punishes efficient small ones.
Allocate it all down to the chair. Rent divides by chairs. Reception and management time divides by chairs. Regional overhead — the district manager, the bookkeeper, the marketing spend — gets allocated across chairs too, usually by chair count or revenue share. It feels tedious the first time. After that it's a spreadsheet formula you never touch again.
If you've already built per-station break-even math for a single location, this is the multi-unit version of that work. The salon P&L playbook on per-station break-even and payroll decision rules is the foundation; portfolio governance just stacks that same logic across every unit and forces the comparison.
The core KPIs that belong in a normalized portfolio view
You don't need forty metrics. Six or seven, taken together, tell you whether a chair is earning, whether a location is healthy, and whether cash is accumulating or draining. More than that and your monthly review turns into a reading assignment nobody finishes.
Stop losing appointments in the chaos.
Salnly helps you book, confirm & manage every appointment—efficiently.
- Centralized appointment management
- Client notifications
- Calendar & staff scheduling
No credit card required
The ones that actually drive capital decisions:
-
Revenue per chair — the top-line productivity signal
-
Contribution margin per chair — what's left after direct and allocated costs; the single most important number in the whole system
-
Chair utilization — booked hours divided by available hours, which explains why revenue per chair is high or low
-
Fixed-cost coverage ratio — contribution divided by location fixed cost, showing how much cushion exists before a slow month hurts
-
Trailing cash runway — months of operating cost the location (and the portfolio) can survive at current burn
-
Revenue per chair trend — three-month direction, because a healthy-but-declining unit needs different action than a weak-but-climbing one
Utilization sits next to revenue per chair deliberately. A location with low revenue per chair but high utilization has a pricing or service-mix problem — the chairs are full but earning too little. Low revenue per chair and low utilization is a demand problem — not enough clients coming through the door. Same symptom, completely different fix. Looking at revenue per chair alone would send you down the wrong road.
Runway thresholds: the line between patience and panic
Capital allocation without runway thresholds is just guessing with confidence. You need pre-decided lines that trigger action regardless of how you feel about a location on any given day.
The useful move is defining runway at two levels: per-location and portfolio-wide. A single location can run thin temporarily if the portfolio is strong — that's actually the point of running multiple units. But when portfolio runway drops below a threshold, every location decision changes because you're now protecting the whole operation.
-
Portfolio runway above 6 months normal operations. You can invest, hire, and take swings.
-
Portfolio runway 3–6 months caution mode. New capital projects pause. Underperformers get put on a clock.
-
Portfolio runway under 3 months triage. You're reallocating cash toward survival and seriously evaluating the weakest unit for closure or lease exit.
Write these down before you're stressed, because under pressure owners do the exact wrong thing — they pour cash into the struggling location out of loyalty, draining the healthy ones that could've carried everyone through. Thresholds protect you from your own instinct. If you've already mapped cash runway and unit economics, the salon growth planning framework on cash runway and unit economics pairs naturally here — growth planning tells you when you can expand; governance thresholds tell you when you must stop.
Capital allocation rules: invest, reallocate, or close
This is where governance earns its name. The whole point of normalizing the numbers is to run them through a consistent decision rule instead of re-litigating every location's fate from scratch each quarter.
The rule set maps two things: contribution per chair against trend direction. Where a location falls in that grid tells you what to do with it.
The decision grid
-
Strong contribution + improving or stable trend → Invest. New capital goes here. A chair already earning solid contribution, trending flat or up, is the safest return you have. Renovate it, add a chair if demand supports it, upgrade the equipment that lets senior stylists work faster. Put money where it already works.
-
Strong contribution + declining trend → Protect and diagnose. Something is eroding a good unit — a competitor opened nearby, a key stylist left, scheduling slipped. Don't throw capital at it yet. Find the cause first. Capital can't fix a departed stylist's book.
-
Weak contribution + improving trend → Reallocate operationally, not financially. This location is climbing. It usually doesn't need cash — it needs better scheduling, pricing, or staff-mix decisions borrowed from your stronger units. Give it your best manager's playbook, not your checkbook.
-
Weak contribution + flat or declining trend → Close, exit, or restructure. A location that earns little and isn't getting better is a slow bleed on the whole portfolio. The rule forces the conversation most owners avoid for a year too long.
The grid isn't a verdict you follow blindly. It's a forcing function that makes you justify exceptions out loud instead of drifting. When you want to keep funding a quadrant-4 location, you have to name the specific reason — a lease you can't exit, a market you're entering, a turnaround plan with a hard deadline. "It's our second store, I can't close it" isn't a reason. It's the emotion the grid exists to overrule.
Sensitivity tables: stress-testing before you commit
Before any invest decision, run a quick sensitivity table. The question you're answering: how wrong can my assumptions be before this becomes a bad decision?
For a $45k renovation projected to lift revenue per chair, build a small grid that varies the lift (say, +8%, +12%, +18%) against utilization holding or slipping. If the project only pencils out at the optimistic corner — high lift and perfect utilization — it's fragile. If it pays back reasonably even at the conservative corner, it's robust. You're not looking for precision. You're looking for whether the decision survives being wrong.
Most owners skip this because it feels like overkill for a salon. But a $45k mistake across five locations is the difference between a comfortable year and a tight one. Five minutes of stress-testing is cheap insurance.
The monthly portfolio review pack
A governance system that lives in your head isn't a system. It's a mood. What makes it real is a repeatable monthly pack — the same document, same metrics, same order, every single month — that you and your managers walk through to turn numbers into actual decisions.
A workable structure for the pack:
-
Portfolio summary page — total revenue, blended contribution per chair, portfolio runway, and the single biggest change versus last month.
-
One page per location — the six core KPIs, three-month trend lines, and the location's current grid quadrant.
-
Exceptions and flags — any location that crossed a threshold, any chair that dropped below its break-even contribution, any utilization swing worth explaining.
-
Capital requests and decisions — anything asking for money, run through the allocation grid and a sensitivity check.
-
Action log — what got decided last month, and whether the expected result showed up.
That last item matters more than it looks. The action log is where governance becomes honest. If you invested in Location C last month expecting revenue per chair to climb, the log forces you to check whether it did. Without it, every decision disappears into the past and nobody learns anything.
Where the data layer usually breaks
The practical obstacle to all of this isn't the thinking — it's the plumbing. Pulling normalized per-chair numbers across five locations by hand, every month, is exactly the kind of task that gets skipped the moment things get busy. Managers export reports in different formats, allocations get done inconsistently, and by the time the pack is assembled it's three weeks stale.
This is where an AI-powered operational platform earns its place — not as a magic answer, but as the thing that assembles the same pack the same way every month without eating a weekend. When your booking, POS, and payroll data feed a single system, the normalization math runs automatically: revenue per chair, contribution, utilization, and runway populate without manual spreadsheet surgery. The useful part isn't that it's AI-driven — it's that the pack shows up on the first of the month, consistent and current, so the review actually happens instead of getting postponed into irrelevance. Consistency is what makes governance stick, and automation is mostly just a way to buy the consistency you'd otherwise have to enforce through sheer willpower.
Here's a simple visual of that monthly pack workflow:
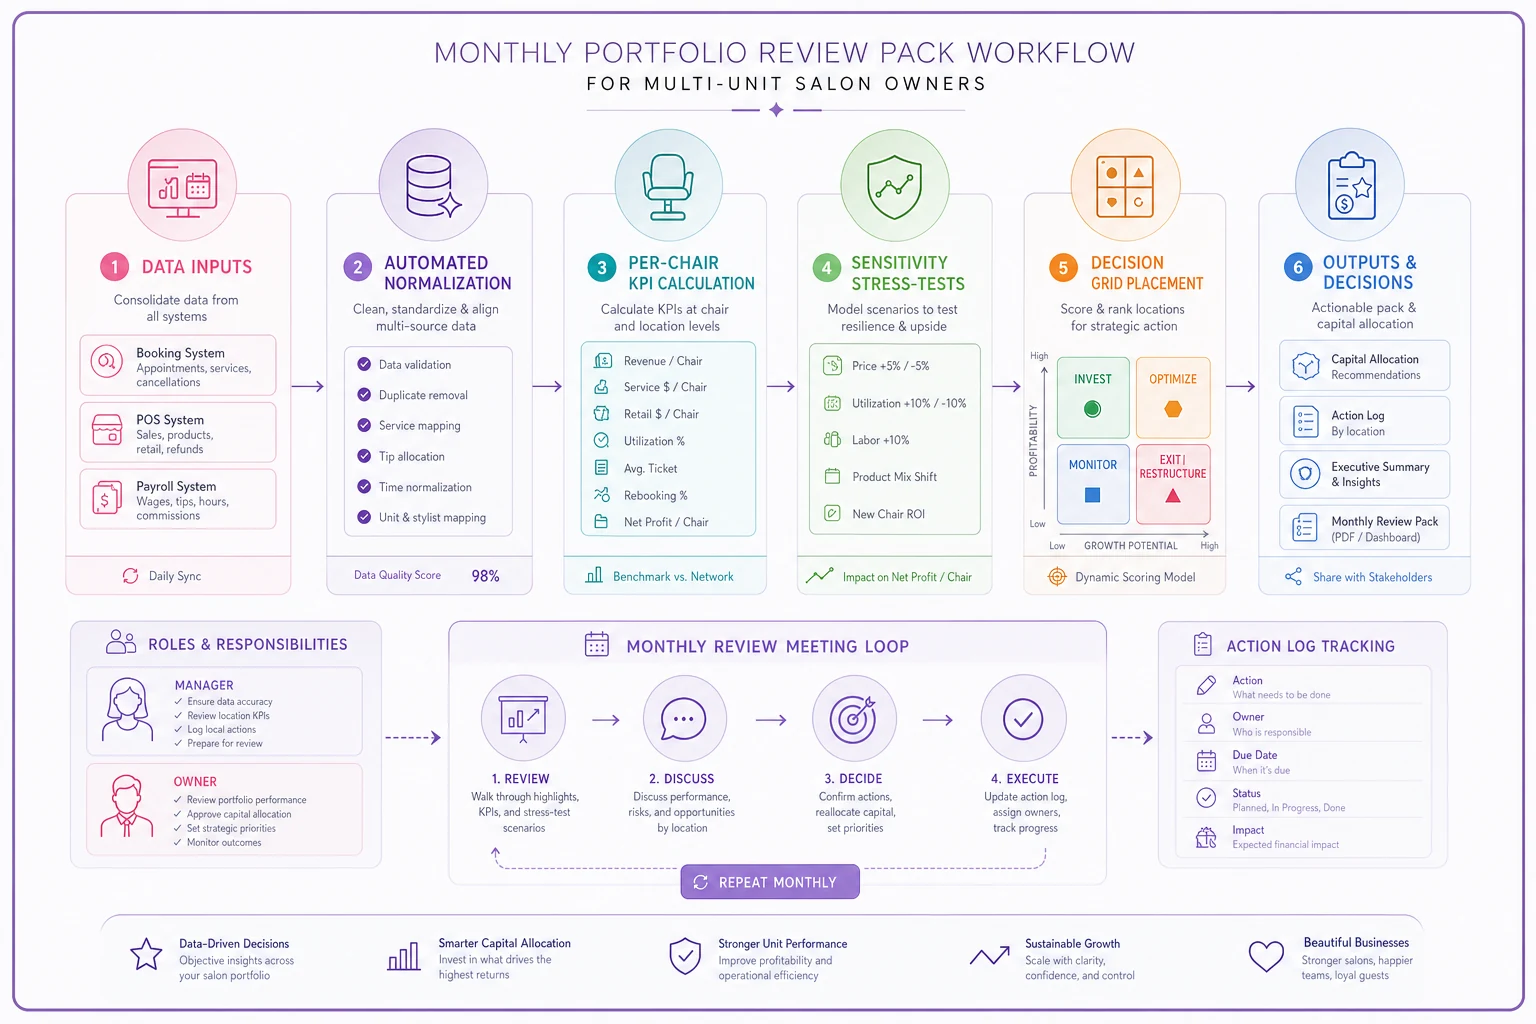
When your booking, POS, and payroll data feed a single system, the normalization math runs automatically and the pack shows up on time, so the review actually happens instead of getting postponed.
A real scenario: four locations, one slow bleed
A regional owner with four salons — two strong, one average, one struggling — had been quietly subsidizing the weak location for most of a year. On the raw P&Ls, the struggling store looked "only a little behind," so it never triggered alarm. Revenue was around $44k monthly; it felt fixable.
Normalized per chair, the picture changed. The struggling location had 9 chairs producing roughly $4,900 revenue per chair, against a fully-loaded cost near $5,300 — negative contribution per chair, month after month. Meanwhile the two strong locations were throwing off contribution per chair above $3,000, and that money had been drifting toward propping up the weak unit instead of growing the winners.
Running it through the grid, the struggling store landed squarely in quadrant 4: weak contribution, flat trend, no credible turnaround plan beyond "try harder." The owner didn't close immediately — the lease had eight months left — but stopped new investment, cut the chair count from 9 to 6 to shrink the fixed burden, and redirected freed-up cash toward a renovation at the strongest location.
Over the following two quarters, the strong location's revenue per chair climbed noticeably after the renovation, and the shrunken weak location crept close to break-even on fewer chairs. When the lease came up, the owner exited cleanly instead of resigning in a panic. The portfolio got healthier not because any single salon transformed, but because capital finally flowed toward what was working instead of what was loudest.
When this system makes sense — and when it doesn't
Portfolio governance is overhead. Worth being honest about when it pays for itself.
When it makes sense:
-
You run three or more locations, or you're actively planning to.
-
Cash decisions between locations are starting to feel political or emotional.
-
You can't answer "which location earns the most per chair" without a long pause.
-
You're considering a renovation, a new lease, or closing a unit.
When it's premature:
-
You have one or two locations you can hold entirely in your head. The spreadsheet overhead outweighs the clarity at that size.
-
Your data is so messy that any normalized number would be fiction. Fix the bookkeeping first — garbage normalized is still garbage.
Who should be careful: owners who'll use the grid as cover to close a location that's genuinely recoverable. The framework is a decision aid, not an autopilot. A weak-trend quadrant-4 store with a brand-new manager who's three months into a real turnaround isn't the same as one that's been bleeding for two years with no plan. Read the trend and the context.
If you're pushing past five locations, the governance demands get heavier and start touching standardization, regional structure, and control systems — the guide to scaling salon operations beyond five locations with governance picks up where this per-chair framework starts to strain.
The shift that actually matters
The real change governance creates isn't a better spreadsheet. It's that you stop treating your locations as a collection of individual businesses you're emotionally attached to, and start treating them as a portfolio where money should flow toward its best use — consistently, on the numbers.
That shift is uncomfortable the first time it tells you to shrink or close something you built. Most owners stall on it longer than they should. But the alternative is a slow, invisible bleed where your best locations quietly fund your worst ones, and nobody decides anything until the bank account forces the decision for you.
Normalize the chairs. Write down the thresholds. Run the grid every month. When the next $40k or the next lease decision shows up, you already know exactly where it should go, and you can prove it.
Normalize the chairs. Write down the thresholds. Run the grid every month. When the next $40k or the next lease decision shows up, you already know exactly where it should go, and you can prove it.
Ready to simplify your salon operations?
Join 1,000+ salons using Salnly to save time, reduce scheduling chaos, and deliver better client experiences.